Copyright © 2016 -2026, The Troy Press

Copyright © 2016 -2026, The Troy Press
Copyright © 2016 -2026,
The Troy Press
We are seriously asking for your input. We invite you to contact us and tell us what you think, and ask questions - we genuinely want to answer all good questions if we can. Most of our web pages have a comment section, you can mail us and if you want to donate, click here.
(We fixed the glitch in our automation engine!)
Yes, one of us has a genuine scientific background and knows how to process this data, and other volunteers have data processing backgrounds so we are taking primary source data and processing it to create data-sets not otherwise easy to get, and processing it to provide information to the public. And, of course, this entire effort was spurred by the fact that the Main-Stream Press in the USA has done so badly, and some of the numbers are so very hard to find. ... Don't find what you want? You know what to do, ASK! Above we share how you do that.
While we do not pretend we are sufficiently funded to do much, we realized we have some resources, the background skills & technological chops, and contacts in key places to be able to at least provide some better-than-most non-technical eporters, the public, where we can.
First, let's divide this work into two groups: projection and data analysis. Projection is the art of pretending you can foretell the future and data analysis is the art of taking what has happened and trying to figure out what it means.
Our first computing effort regarding the SARS-CoV-2 virus and the Covid-19 Pandemic it started was to take the primary factors in pandemic spread and compute them for the USA based on the latest information available regarding appropriate values for these factors.
This work was premised on the fact that the USA was an unprotected population that wasn't doing anything effective at stopping the spread. We quickly learned that the most pecimistic values and most optimistic values were both wildly wrong, and began to home in on much better values. Using the numbers for Italy, we were able to project their case growth curve pretty well, then did reasonably well for the USA, too.
This work proved two things:
Later, the various social distancing and lock-down efforts have changed that, starting around April 4th, when the steep climb in new cases stopped rising and leveled off. Therefore, we have ended that work, though you can read up on it here, and here.
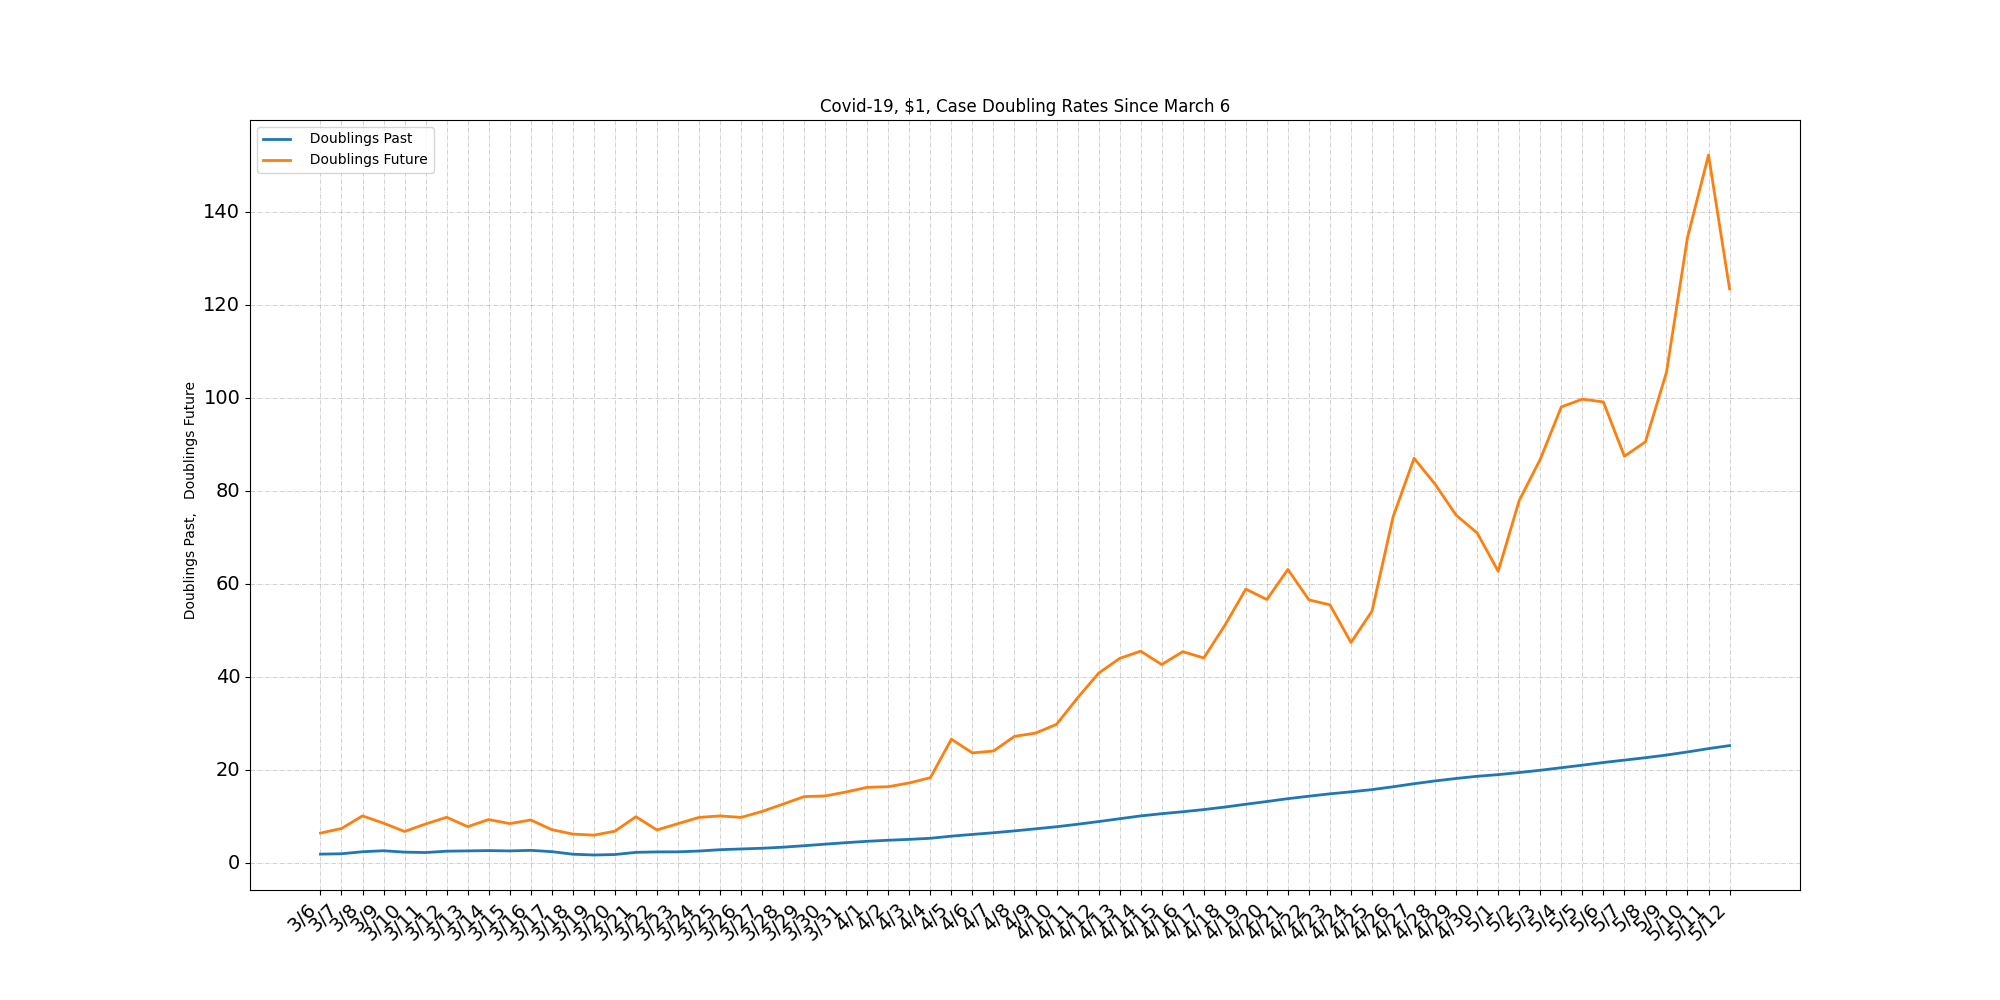
Someone suggested doublings would be intersting to see, and at present, potential future doubling times are all we're projecting.
The idea is simple enough; given the change in new cases from yesterday to today, compute how long it will be for today's number of cases to double.
We start with daily totals for:
CSV Format: These are smply "flat files" in the Comma Separated Value format. Note that the data is not perfect, so we explain the issues, how we have created these, our sources and techniques, etc, below. We also describe data we provide that nobody else does, that we know of.

Depending on the work one is doing in this field, there are various data needs. Here are the basic groups:
We invite you to contact us and tell us what you think. Most of our web pages have a comment section below.
... We haven't added the comment section yet, but we will soon!