Copyright © 2016 - 2022, The Troy Press

Copyright © 2016 - 2022, The Troy Press
Copyright © 2016 - 2022,
The Troy Press
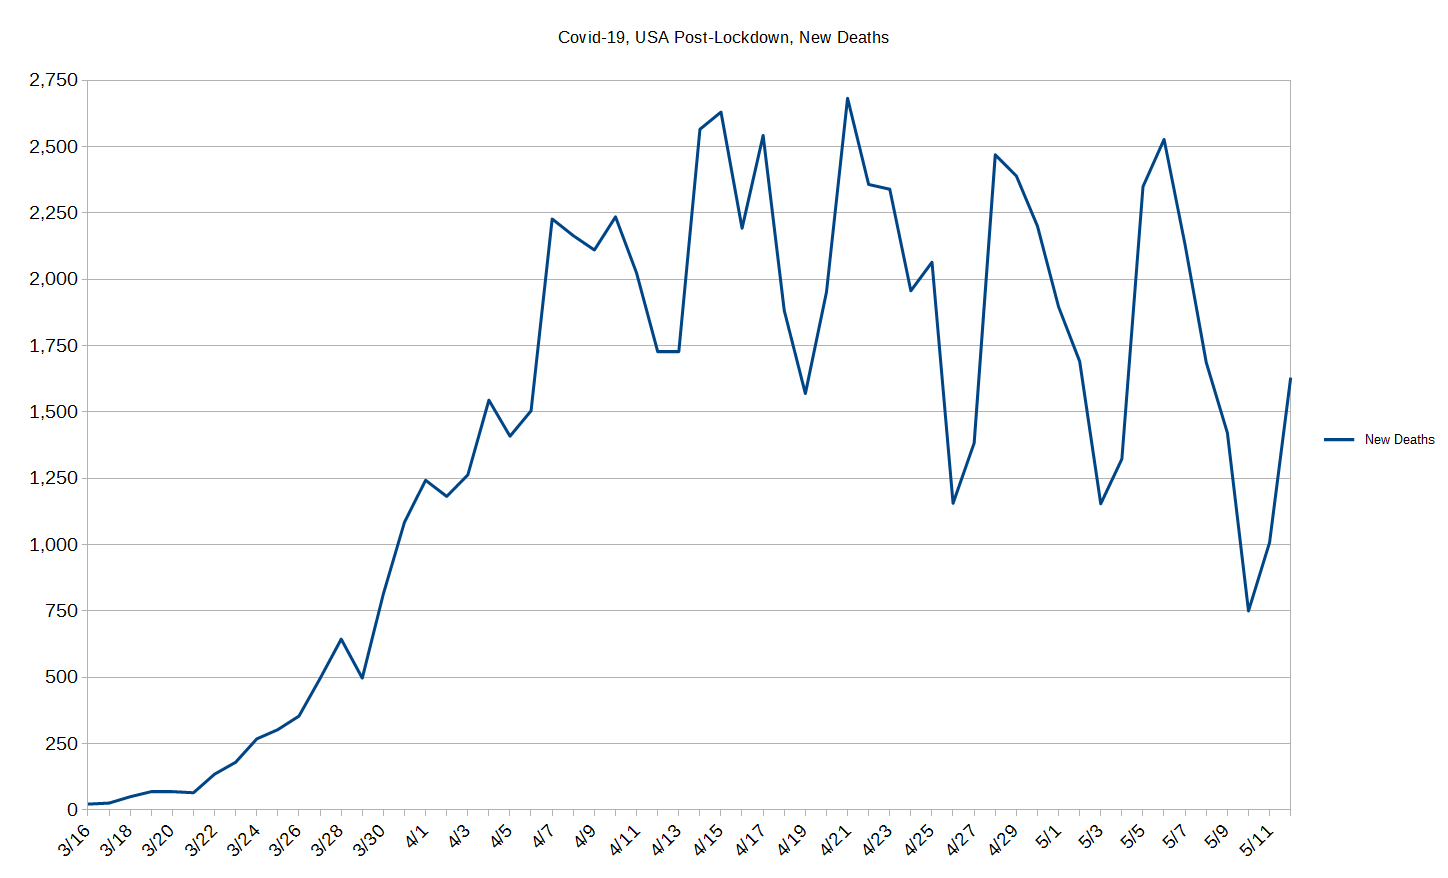
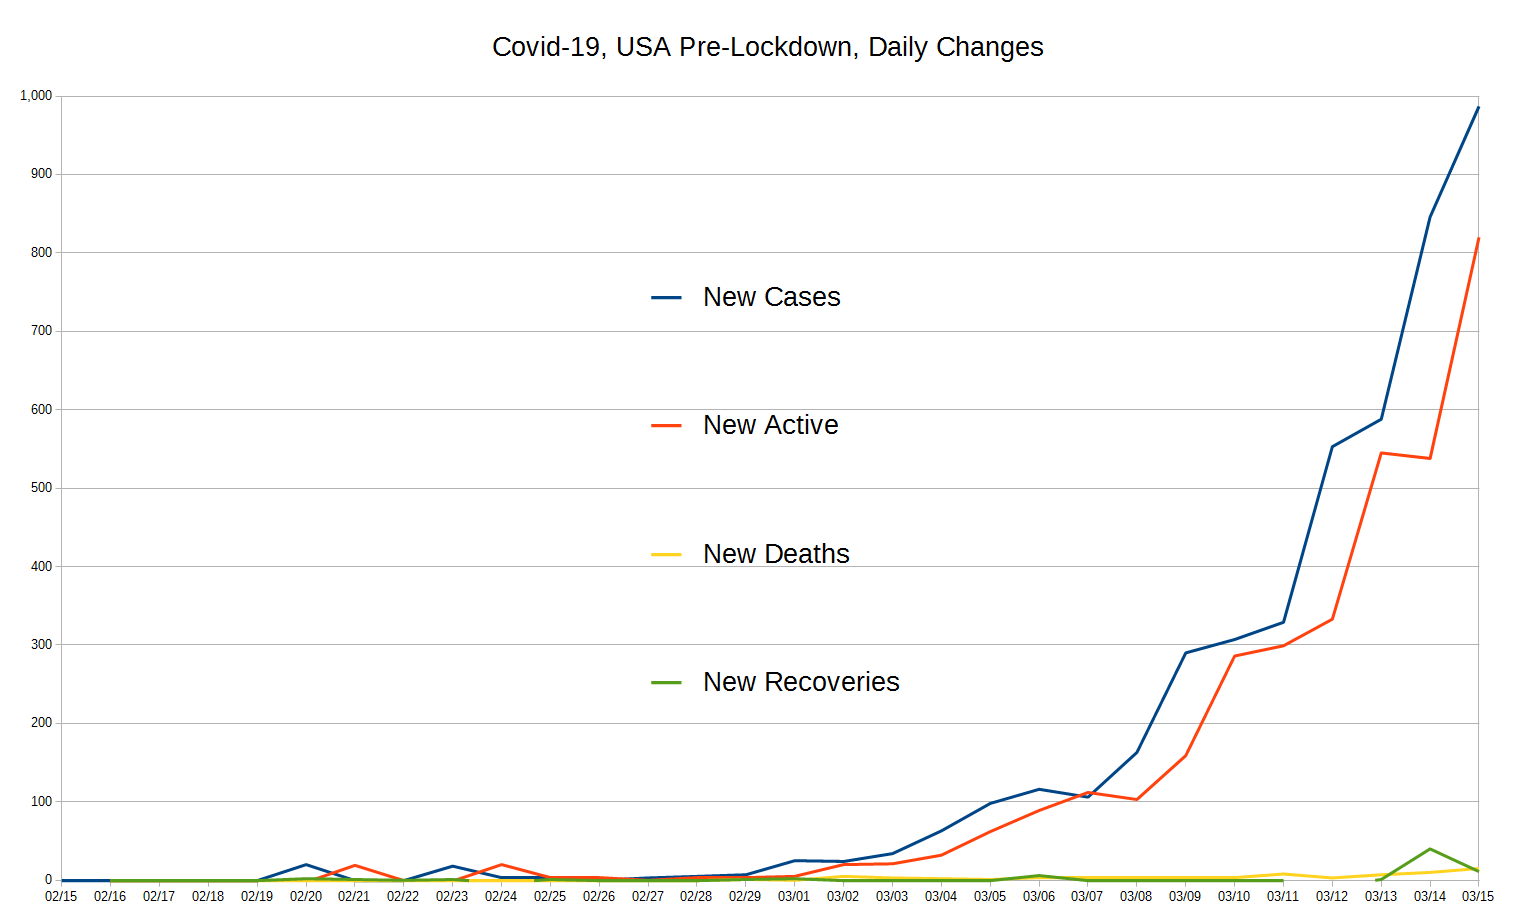
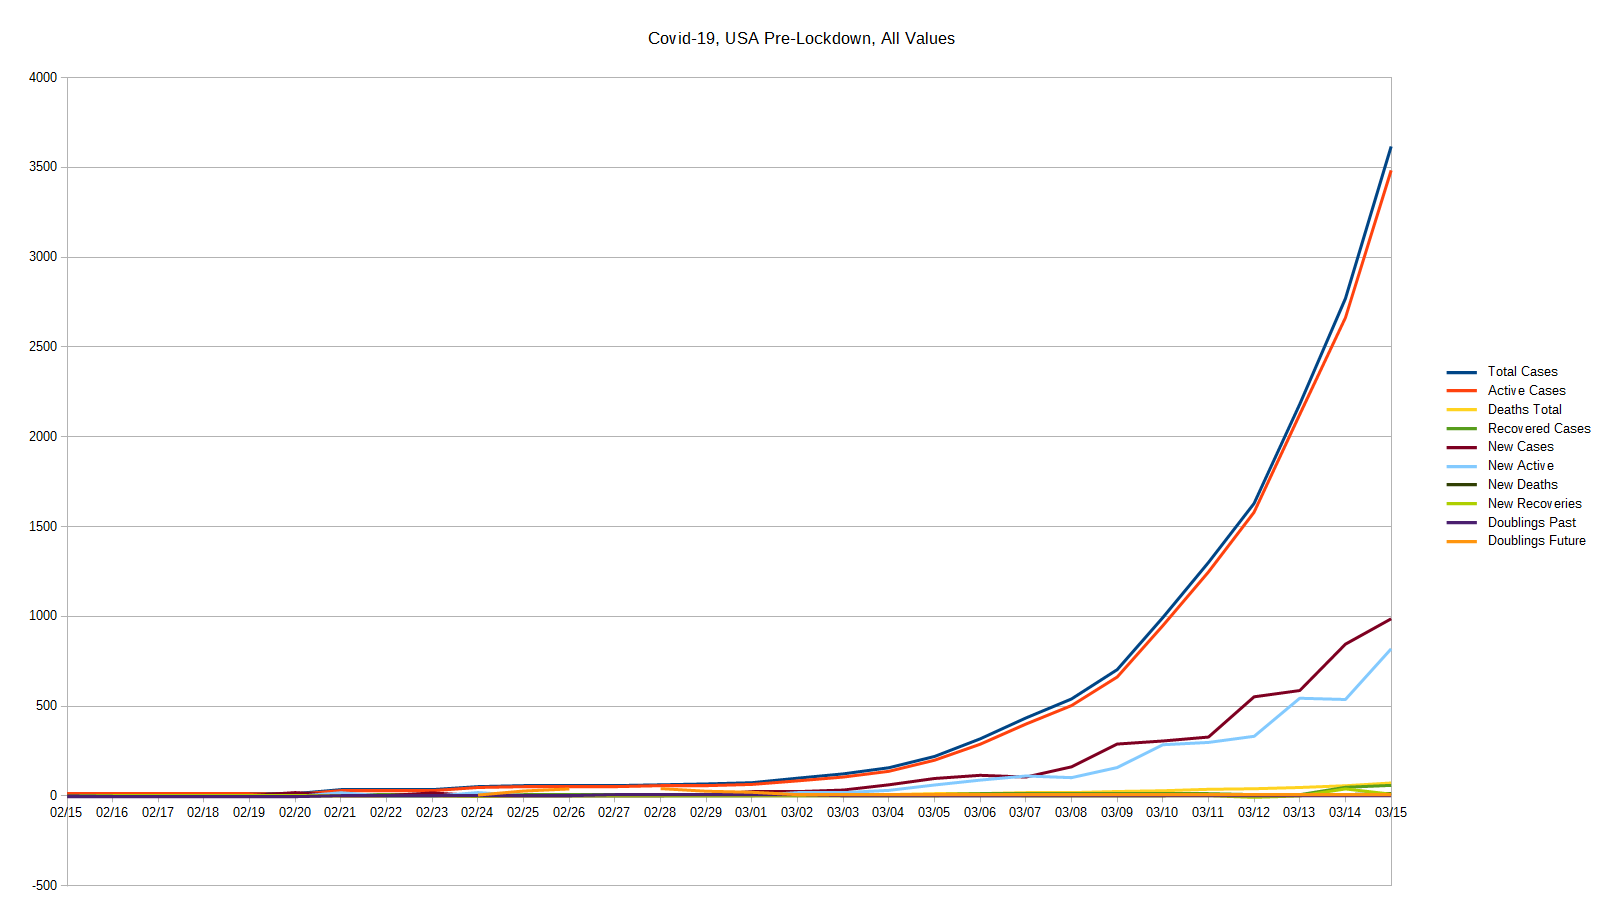
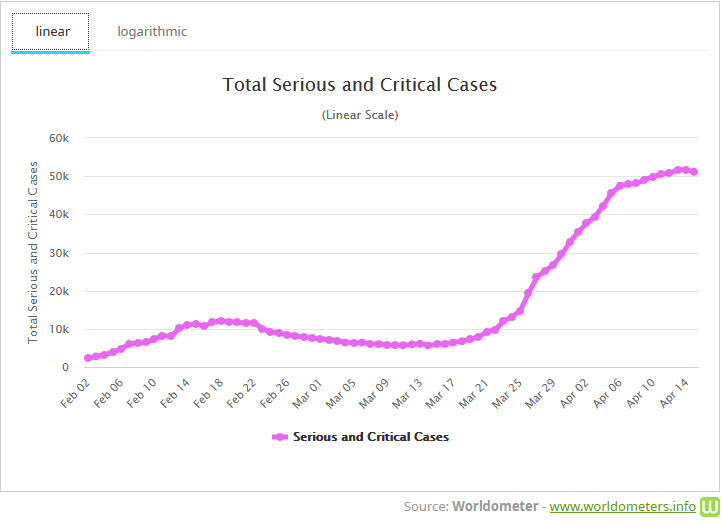
This page is dedicated Covid-19 infections in in the whole USA. For links to individual U.S. State level reporting, click here.
Do let us know what you think or even make requests or ask questions! Please either comment on our main Covid-19 page's comment section, email us, or perhaps, as we're an all volunteer team, donate to our cause.
Our hand-made graphs are easier to read, but time-consuming to make, while our graphs made via automation are likely more up-to-date but harder to read becasue the automation software isn't as capable as the tools we use by hand.
See the graphs that change daily
with discussion of their meaning.
See Our Data-Processing Page,
with annotations and discussion.
CSV Format: These are smply "flat files" in the Comma Separated Value format. Note that the data is not perfect, so we explain the issues, how we have created these, our sources and techniques, etc, on this page. There, we also describe data we provide that nobody else does, that we know of.
Do let us know what you think or even make requests or ask questions! Please either comment on our main Covid-19 page's comment section, email us, or perhaps, as we're an all volunteer team, donate to our cause.